Hottest July on record

R
ggplot2
climate change
global temperature
Author

Jim Milks

Published

August 15, 2023

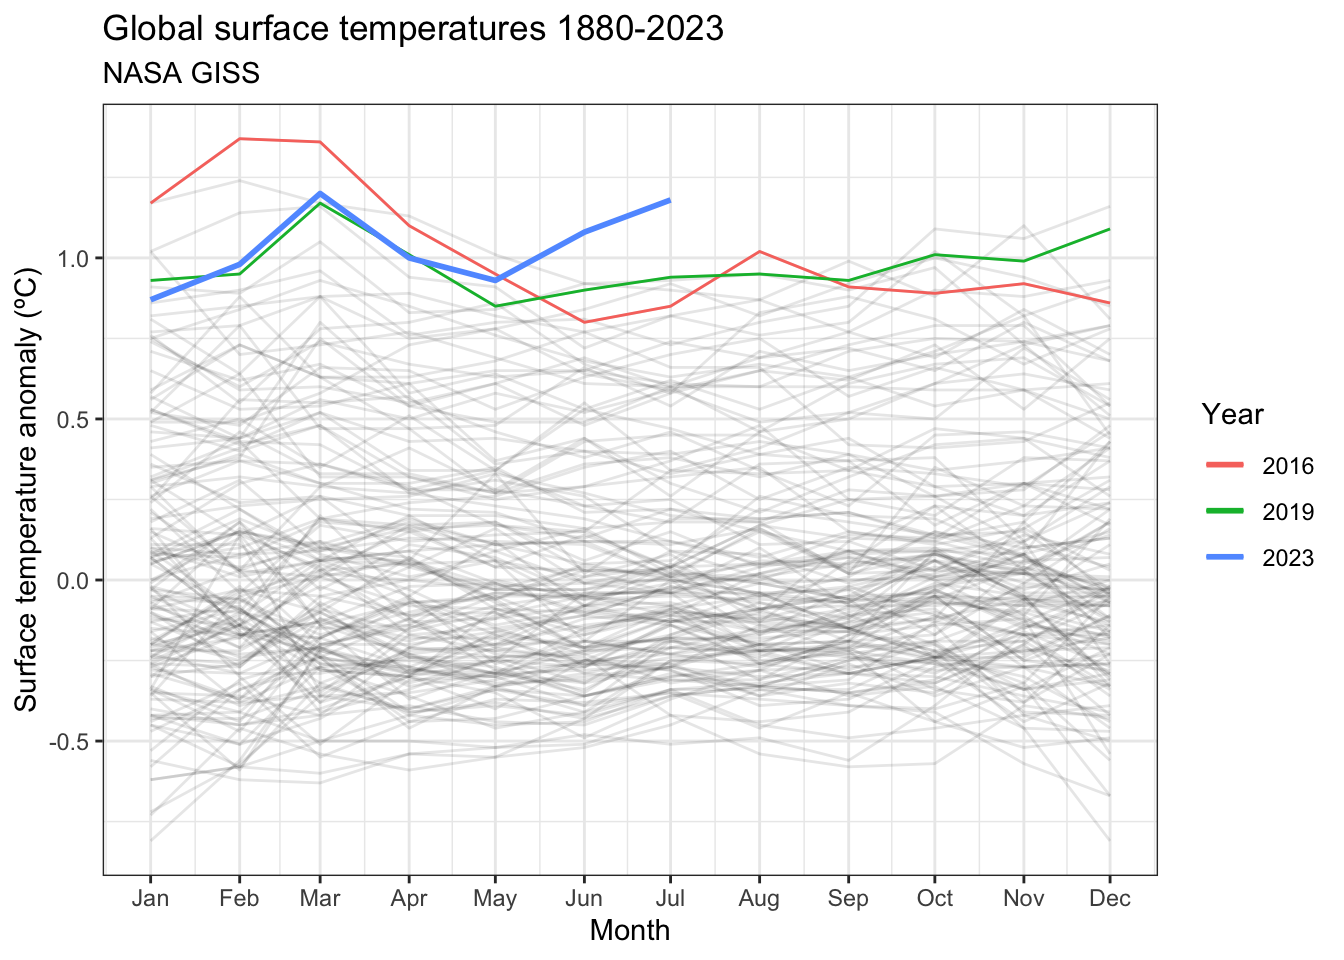
NASA released their global surface temperature average for July 2023. As expected, this past July broke the record set in 2019 for hottest July. It wasn’t even close. The previous record was 0.94ºC above the 1951-1980 baseline. This past July? 1.18ºC, a full 0.24ºC hotter. As hot as it was, July 2023 was not the hottest month ever—that distinction still belongs to February 2016, at 1.37ºC above the baseline.

Show the code
library(tidyverse)

GISS <- read_csv("https://data.giss.nasa.gov/gistemp/tabledata_v4/GLB.Ts+dSST.csv",
                 skip = 1,
                 na = "***") %>%
        select(Year, 
               Jan, 
               Feb, 
               Mar, 
               Apr, 
               May, 
               Jun, 
               Jul, 
               Aug, 
               Sep, 
               Oct, 
               Nov, 
               Dec) %>%
        pivot_longer(!Year, 
                     names_to = "Month", 
                     values_to = "anomaly")
GISS$Month <- match(GISS$Month, month.abb)
GISS$Date <- make_date(year = GISS$Year, month = GISS$Month, day = 1)

GISS %>%
        mutate(Year = factor(Year),
               Date = update(Date, year = 1)) %>%
        ggplot(aes(x = Date, y = anomaly, colour = Year)) +
        scale_x_date(date_breaks = "1 month", date_labels = "%b") +
        geom_line(aes(group = Year), colour = "black", alpha = 0.1) +
        geom_line(data = function(x) filter(x, Year == 2016), lwd = 0.5) +
        geom_line(data = function(x) filter(x, Year == 2019), lwd = 0.5) +
        geom_line(data = function(x) filter(x, Year == 2023), lwd = 1) +
        theme_bw() +
        labs(title = "Global surface temperatures 1880-2023",
             subtitle = "NASA GISS",
             x = "Month",
             y = "Surface temperature anomaly (ºC)")

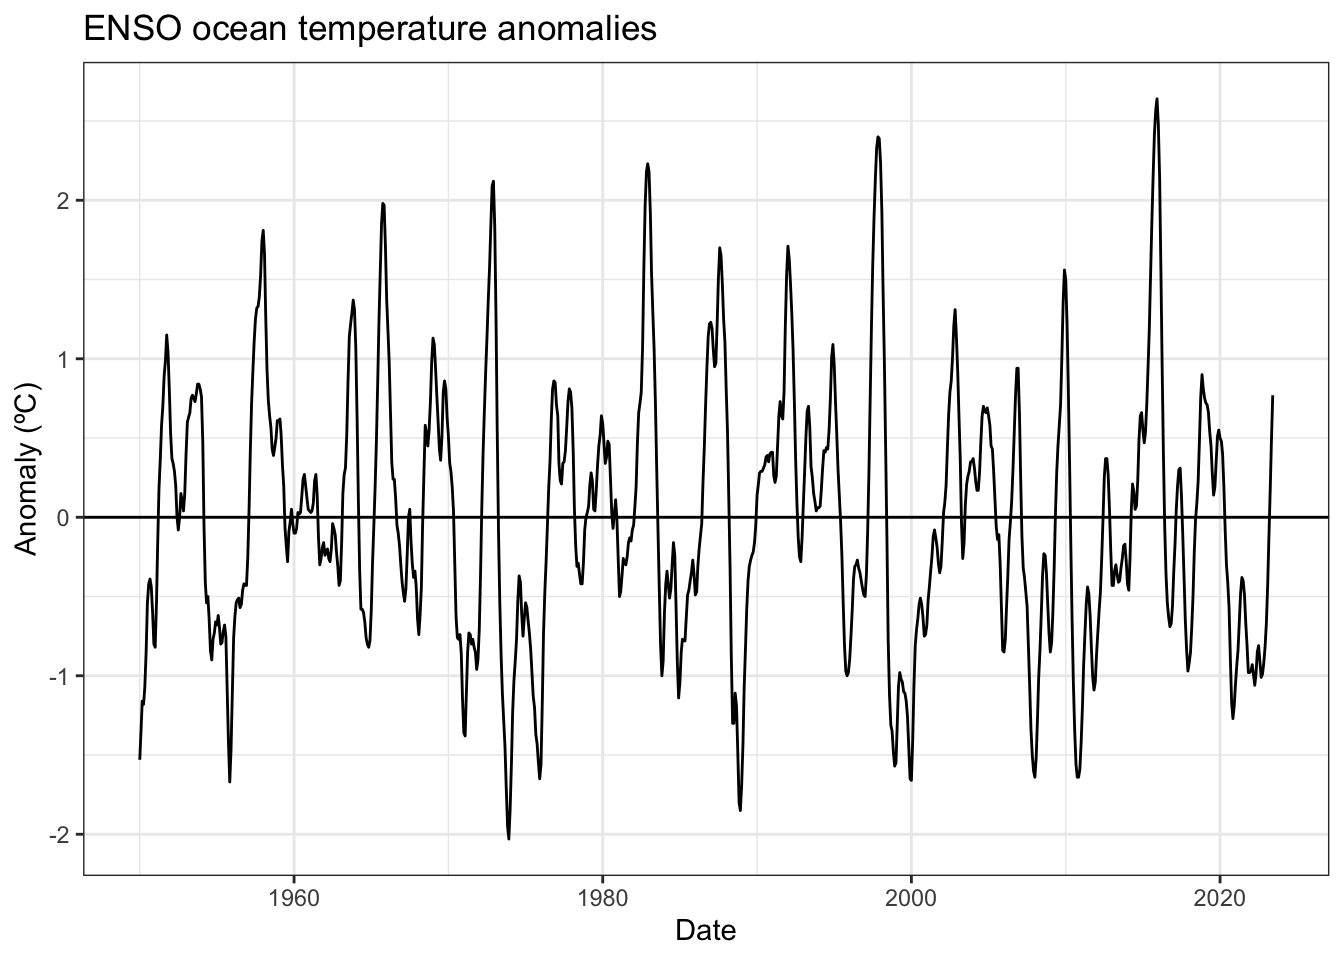
The past two months stand out for another reason. The Northern Hemisphere summer/Southern Hemisphere winter is normally among the coldest months of the year globally. The Southern Hemisphere summer/Northern Hemisphere winter is usually the warmest part of the year. (Blame Earth’s elliptical orbit for that seasonal pattern. The Earth is farthest from the sun during Northern Hemisphere summer and closest during Southern Hemisphere summer.) Thanks to El Niño, that seasonal pattern is not holding this year.

All that means is that 2023 has an excellent chance of being the hottest year on record. The current record holders are 2016 and 2019, both at 1.02ºC above the 1951-1980 baseline. 2023 is currently 1.035ºC above that baseline.

NOAA NCEI data shows a similar pattern. July 2023 was 0.82ºC above the 1900-1999 baseline average, a full 0.20ºC above the previous July record holder in 2019. In contrast to NASA GISS, 2023 is running second so far in the race for hottest year on record in the NOAA data set. The current record holder in NOAA’s data is 2016, at 0.72ºC above the baseline. 2023 is currently at 0.71ºC above the baseline.

Show the code
NOAA <- read_table("https://www.ncei.noaa.gov/data/noaa-global-surface-temperature/v5.1/access/timeseries/aravg.mon.land_ocean.90S.90N.v5.1.0.202307.asc", 
    col_names = FALSE) %>%
        rename(Year = X1, Month = X2, anomaly = X3) %>%
        select(Year, Month, anomaly) %>%
        mutate(Date = make_date(year = Year, month = Month, day = 1))

NOAA %>%
        mutate(Year = factor(Year),
               Date = update(Date, year = 1)) %>%
        ggplot(aes(x = Date, y = anomaly, colour = Year)) +
        scale_x_date(date_breaks = "1 month", date_labels = "%b") +
        geom_line(aes(group = Year), colour = "black", alpha = 0.1) +
        geom_line(data = function(x) filter(x, Year == 2016), lwd = 0.5) +
        geom_line(data = function(x) filter(x, Year == 2019), lwd = 0.5) +
        geom_line(data = function(x) filter(x, Year == 2023), lwd = 1) +
        theme_bw() +
        labs(title = "Global surface temperatures 1850-2023",
             subtitle = "NOAA NCEI",
             x = "Month",
             y = "Surface temperature anomaly (ºC)")

In either data set, June and July 2023 stands out as anomalously hot for the entire planet. Given El Niño conditions, I fully expect 2023 to be crowned as hottest year on record when all the data is in next January.

Show the code
ENSO <- read_table("https://www.cpc.ncep.noaa.gov/data/indices/oni.ascii.txt")
ENSO$Time <- seq.Date(from = as.Date("1950-01-01"), by = "month", length.out = nrow(ENSO))
ENSO %>%
        select(Time, ANOM) %>%
        rename(anomaly = ANOM) %>%
        ggplot(aes(x = Time, y = anomaly)) +
        theme_bw() +
        geom_line() +
        geom_hline(yintercept = 0) +
        labs(title = "ENSO ocean temperature anomalies",
             x = "Date",
             y = "Anomaly (ºC)")


Comment Section

Notes, suggestions, remarks? Feel free to leave a comment below.